

How your results change
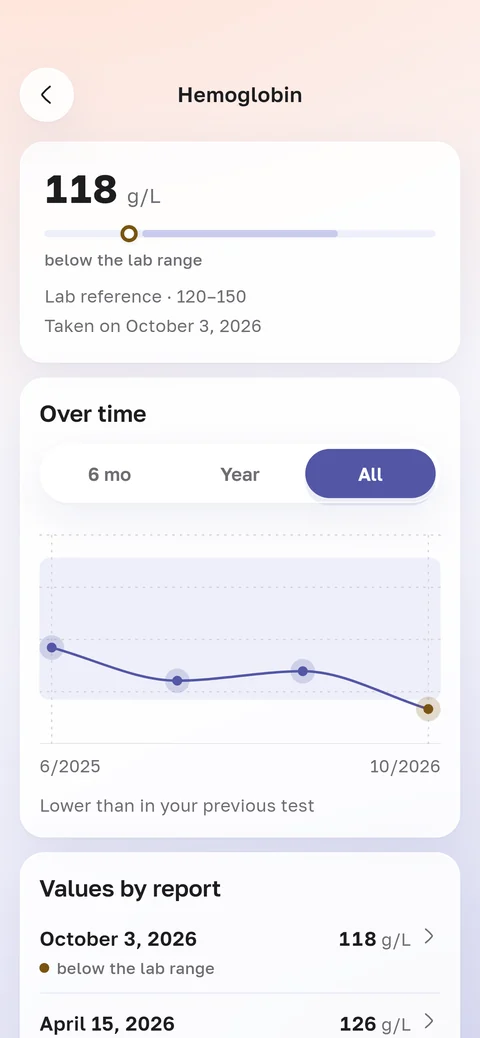
One report shows only one day. HemoTrack puts every value of a result on one chart, so you can see where it is heading.
Why the trend matters
A result can change slowly and stay within the range for a long time. On a single report this is easy to miss. In the example below, hemoglobin dropped below the lab range within a year.
What the chart looks like
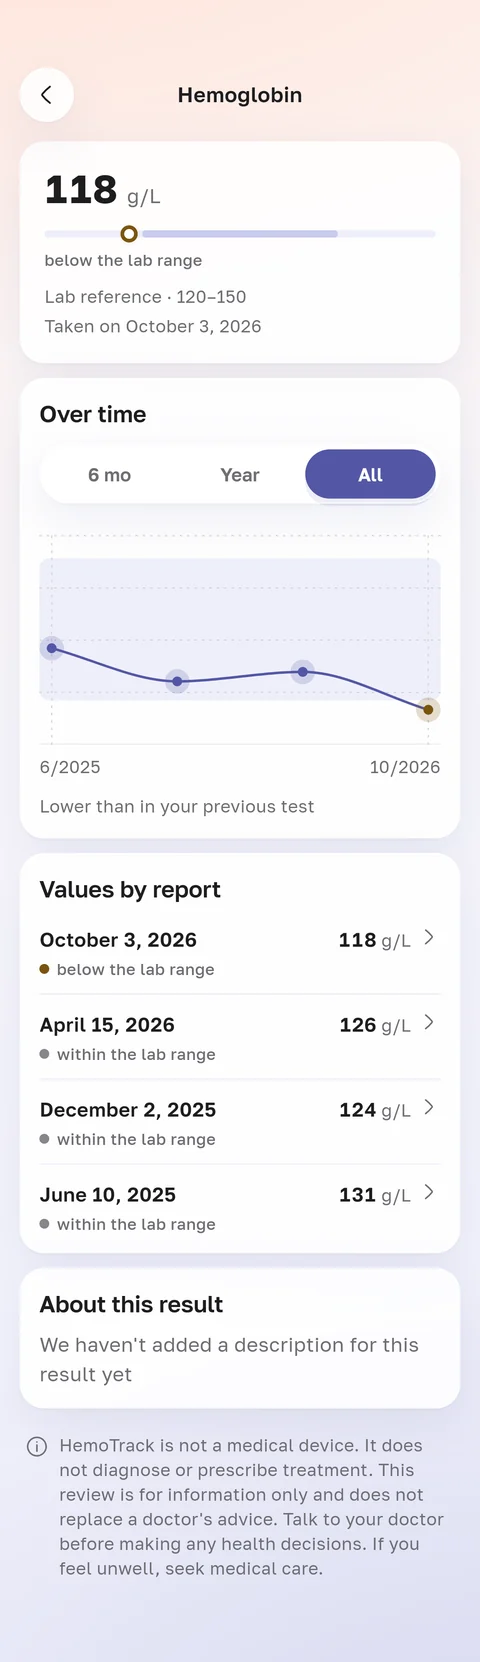
A band for the lab’s range
A light band on the chart shows the range. You can see at once where a value sits inside it and where it has come close to the edge.
A point for every test
Below the chart is a list of values with dates. From there you can open the report each point came from.
Six months, a year or all time
Switch the period to see the last few months or the whole history. Under the chart the app says whether the result went up or down since last time.
How to add old reports
The more old tests you add, the sooner you see where a result is going.
Find your old reports
Paper reports work, and so do PDFs from your email or the lab’s website.
Upload them one by one
Tap “+” and choose the camera, a PDF or a photo from your gallery. A report with several pages can be shot page after page.
Wait a minute
The app reads the report, and the values land on the chart by the date of the test.